Why is climate risk mapping now an indispensable tool?
Frédérique Delafosse. It’s the standard tool that allows us to measure and assess how climate hazards are evolving across a given area. Our clients expect educational visual representations to visualize the exposure of their assets. From the outset, we’ve been working with geographic information systems that make it possible to layer a digital terrain model with infrastructure data or climate-related maps.
Swann Lamarche. Mapping is a way of representing the state of the world, and adapting to climate change inevitably requires understanding the world and how it’s evolving. This explains the IGN’s position on the “Anthropocene Atlas,” which aims to describe France from a cartographic perspective. We also aim to move closer to real time in order to reflect these changes.
Who provides the mapping data?
FD. We work with exposure data and sensitivity data. The former is generally public and accessible. It comes from IPCC reports or Météo France and can cover heat, rainfall, wind, and so on. This data is then combined with sensitivity data, which doesn’t exist in raw form. For example, a poorly insulated building will be sensitive to rising temperatures. A highway with a poorly maintined surface will be more sensitive to flood risk. Combined, these datasets make it possible to assess infrastructure vulnerability.
SL. We collect our data in various ways. We have been acquiring aerial photographs for several decades. We also produce a complete 3D map of the territory using the LiDAR program, which has numerous applications. And we build specialized databases such as Large-Scale Land Use (Occupation du sol à grande echelle – OCS GE), which allows us to classify land uses and plays a key role in the Zero Net Artificialization approach.
Our work also relies on numerous partnerships, such as with the ONF (the French National Forestry Office) and the French Ministry of Agriculture for forest inventories, and with the French Ministry of Ecology for flood-related issues. We also collaborate with other government operators such as Shom (the Naval Hydrographic and Oceanographic Service) on everything related to the land-sea interface. Through the Datalliance program, we also work with startups to overcome technological hurdles.
Finally, open data and shared updates are at the core of our approach. For example, Vinci has expertise in the road sector that could enrich our database. This commitment to sharing comes together in our geo-platform, which is open to both public and private partners.
What makes climate mapping different from traditional mapping?
FD. Climate maps are based on long-term hypotheses that are difficult to verify in the short term. When we estimate the risk of rising temperatures, we’re working with a lot of uncertainty. That uncertainty requires us to move forward with rigor, to avoid any skepticism.
SL. Another major difference concerns time. Mapping the effects of climate change is evolving very quickly, whether it’s coastline retreat or melting glaciers. It also requires much more cross-disciplinary work. Today, we’re able to identify flood-prone areas. Tomorrow, we’ll need to be able to identify the origin of these phenomena and their consequences, which means adopting a systemic approach.
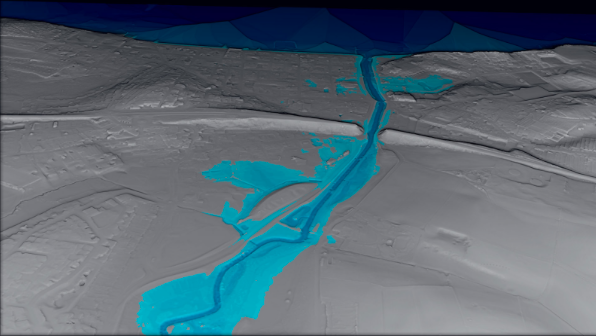
ill : IGN image related to the use of LIDAR data to assess flood risk.
Can you give some concrete examples of how mapping is used for climate adaptation?
FD. One that comes to mind is a tool developed for the VINCI group called ResiLens, which assesses the criticality of infrastructure in relation to 17 climate hazards, according to IPCC scenarios, on a global scale. We are also currently acting as scientific advisors on the ‘Banque des Territoires’ AquaRepère platform project, which focuses on water resource management.
SL. Using the LiDAR program, we can, for example, identify the solar potential of rooftops. We’re also working on a digital twin project for France and its territories. The idea is to build a shared digital foundation so that public or private partners can develop solutions tailored to their own uses.
What are the barriers to developing climate mapping?
FD. The main limit today concerns data accuracy. Projections of exposure to climate hazards rely on current data, which has inevitably been averaged, and on IPCC data, which carry uncertainties. The quality of the input data determines the quality of the mapping.
SL. Data access is indeed a crucial issue. The IGN has chosen to make almost all of its data open access, but that’s not necessarily the case for everyone, and it’s not always realistic, especially for private actors who may have economic stakes at play.
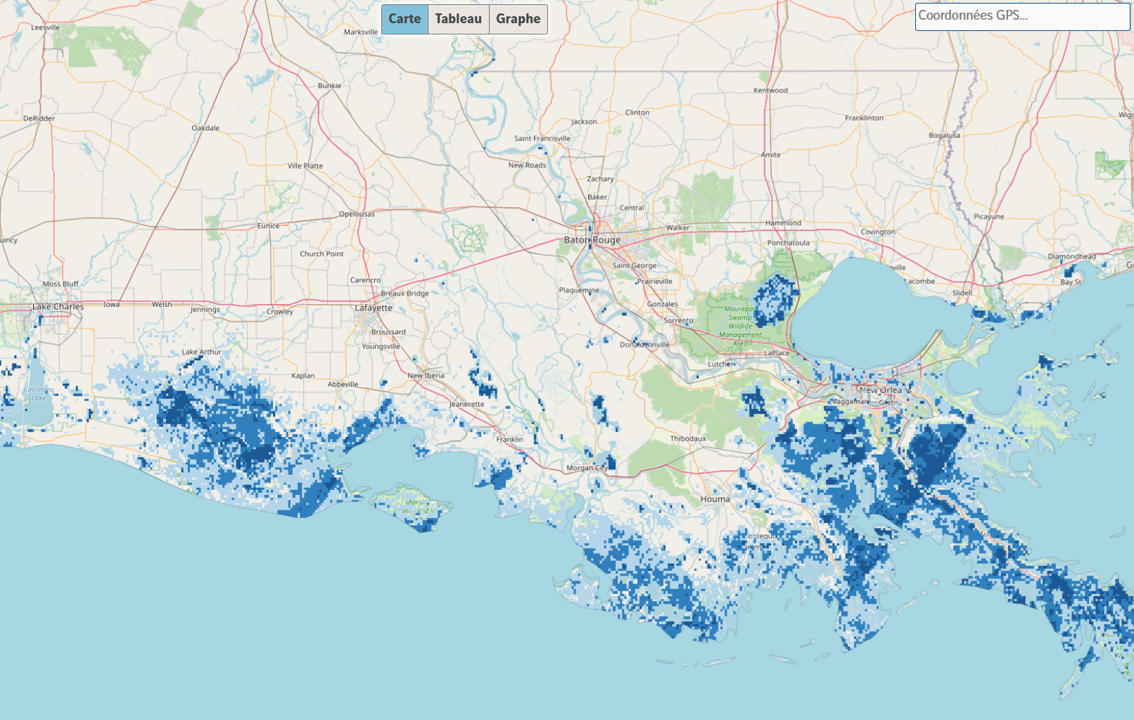
ill : map illustrating sea level rise in Louisiana in 2030 (Resallience)
How do you envision the future of climate mapping?
FD. I believe that climate change adaptation will stop being a specialist subject and start becoming an integrated skill. In this context, mapping tools will help facilitate exchange between stakeholders by increasingly integrating modeling and AI, as well as real-time citizen-sourced data from the field.
SL. Climate mapping faces several challenges. First, it must become accessible to as many people as possible, so that everyone can understand the issue and the necessary choices. Temporality also remains a central issue. We need to increase update frequency to closely monitor changes. This requires the ability to produce and process data quickly. At the IGN, we have begun developing AI tools to enable faster and more comprehensive data processing, particularly for the LiDAR program. Processing 3D data acquired over 550,000 km² raises significant technological questions.